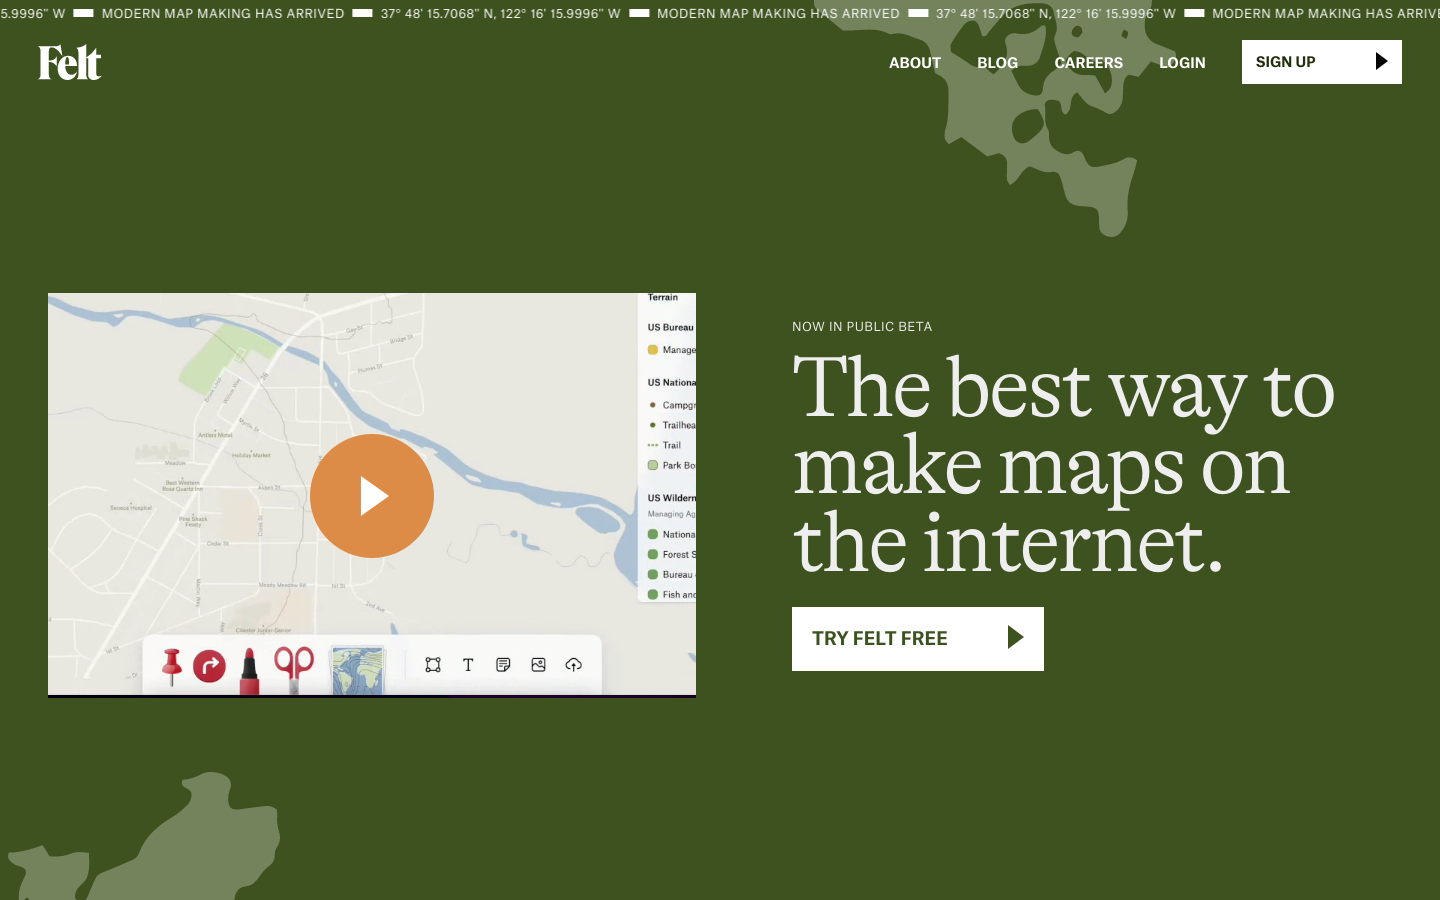
Felt
Introducing the world’s best way to make & share maps on the internet.

Explore 215 projects in the Data Visualization category of the Civic Tech Field Guide.
Introducing the world’s best way to make & share maps on the internet.
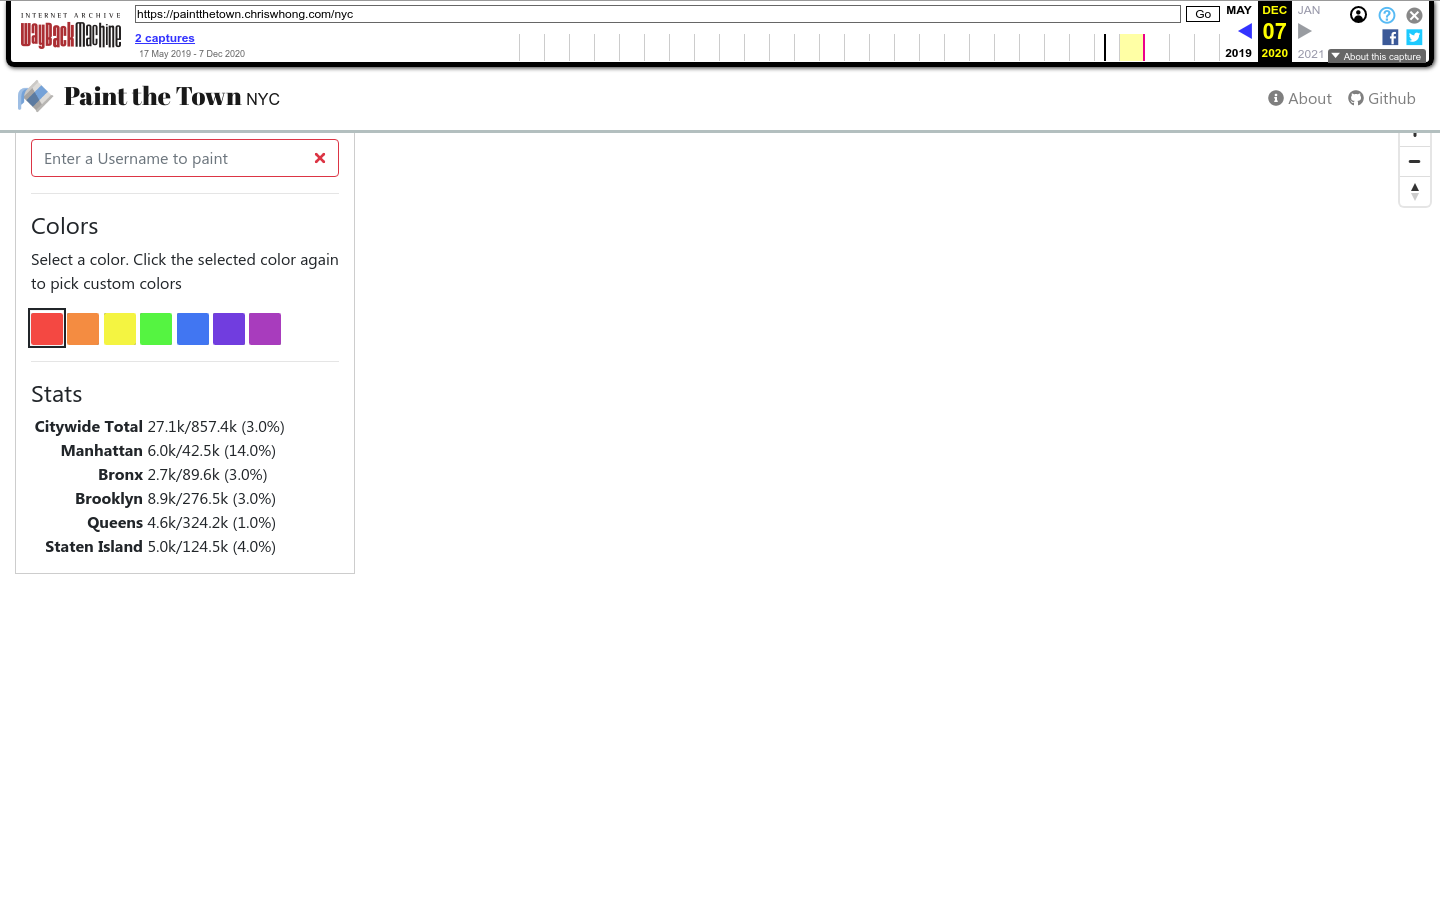
Paint the Town is a collaborative data art project. It allows anyone to paint a New York City tax lot to any color they choose.
As the US approaches its 250th anniversary, AI enables a new type of conversation amongst Americans on freedom & equality.
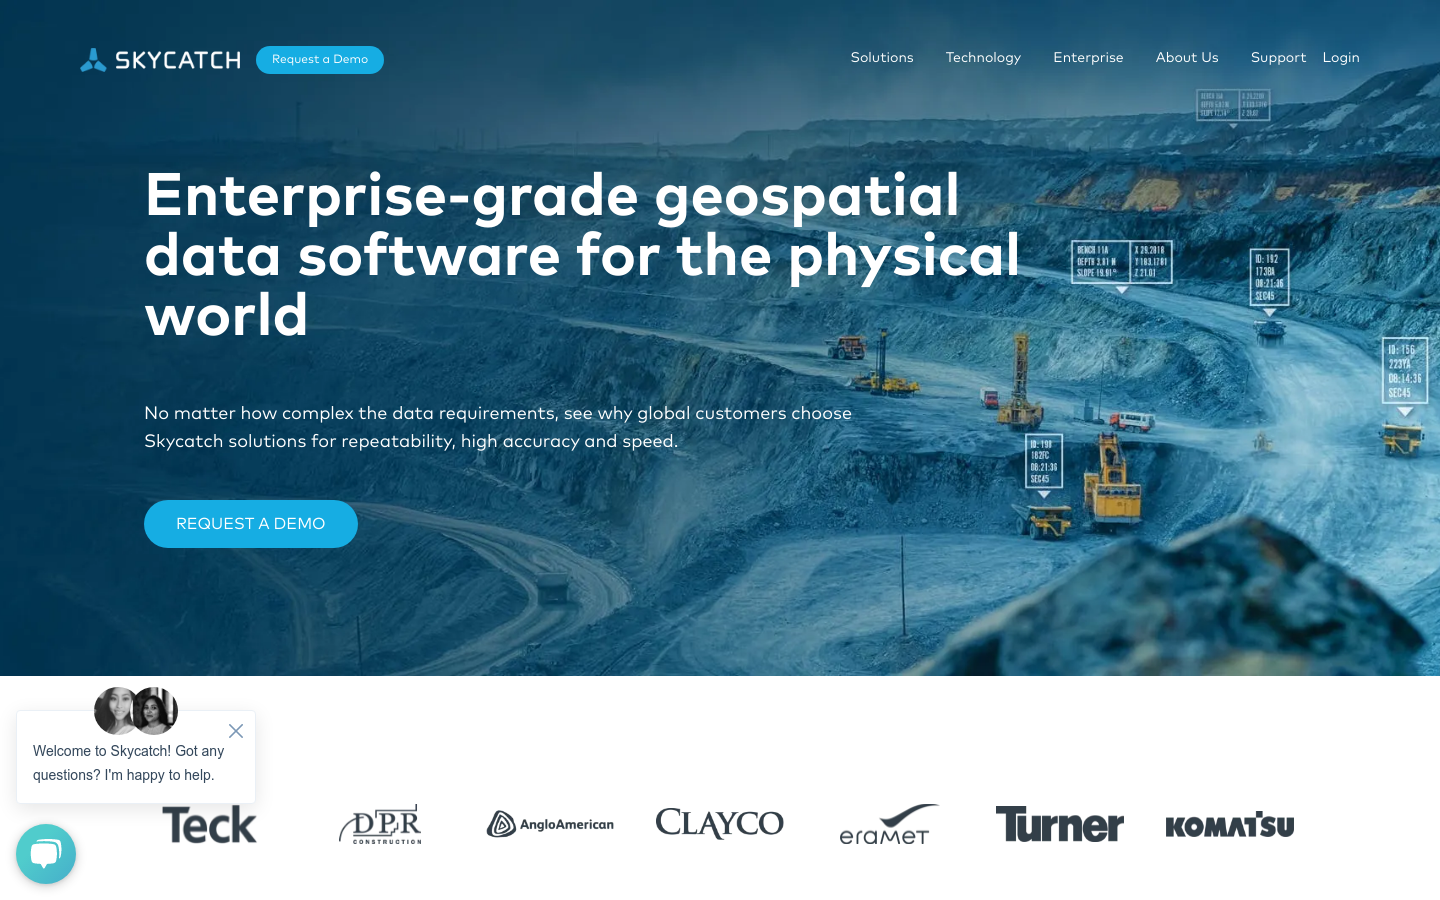
Drone maps and 3D models processed in the cloud for construction, mining, energy, & more.
Our comprehensive database analyzes banking and financial apps to reveal what data they collect and how they use it.
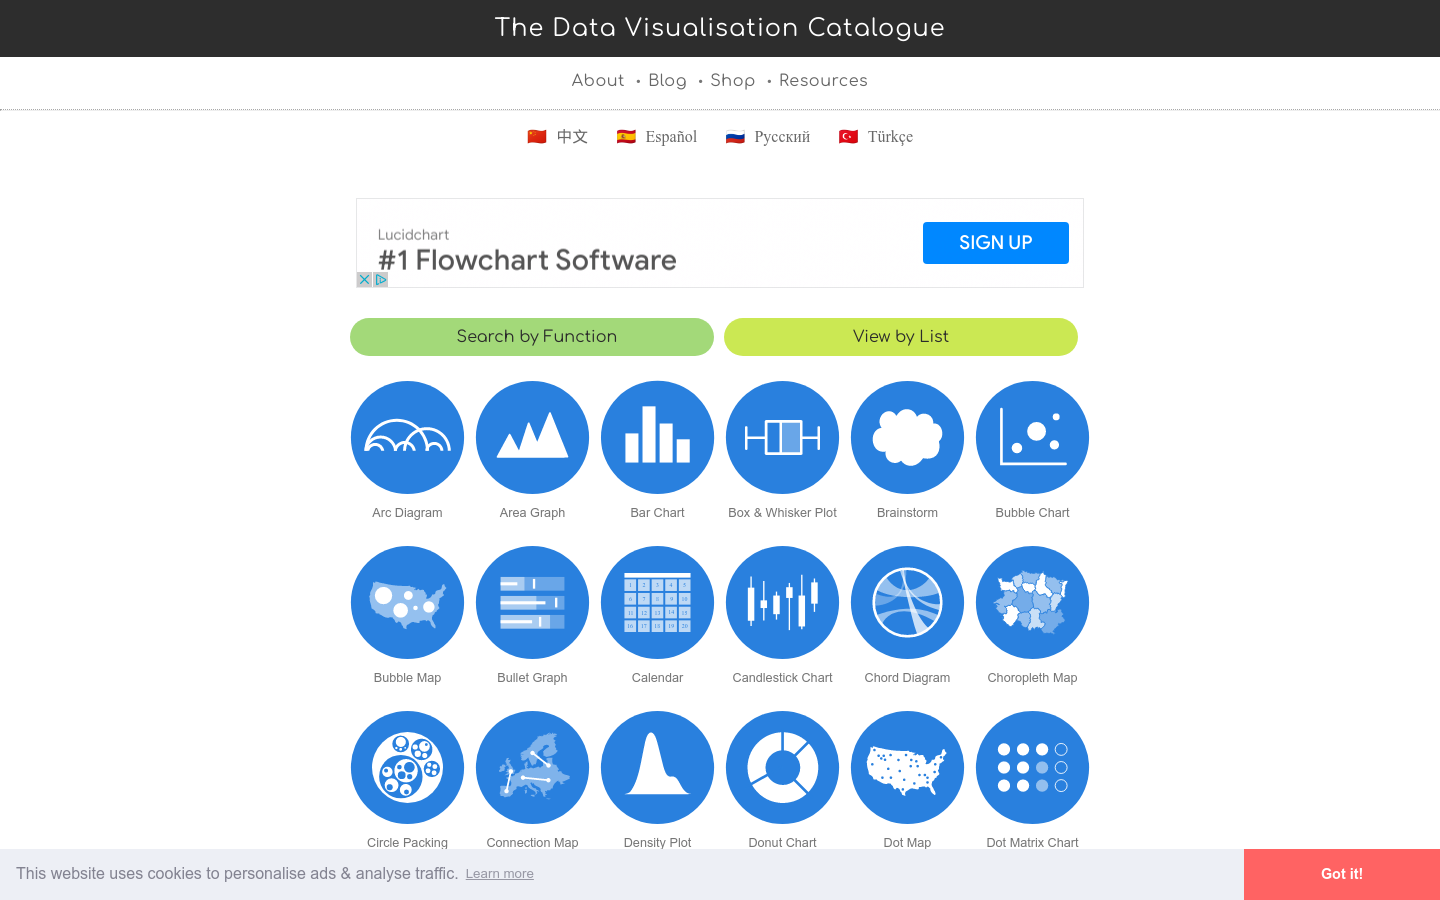
Best ways to communicate your data.
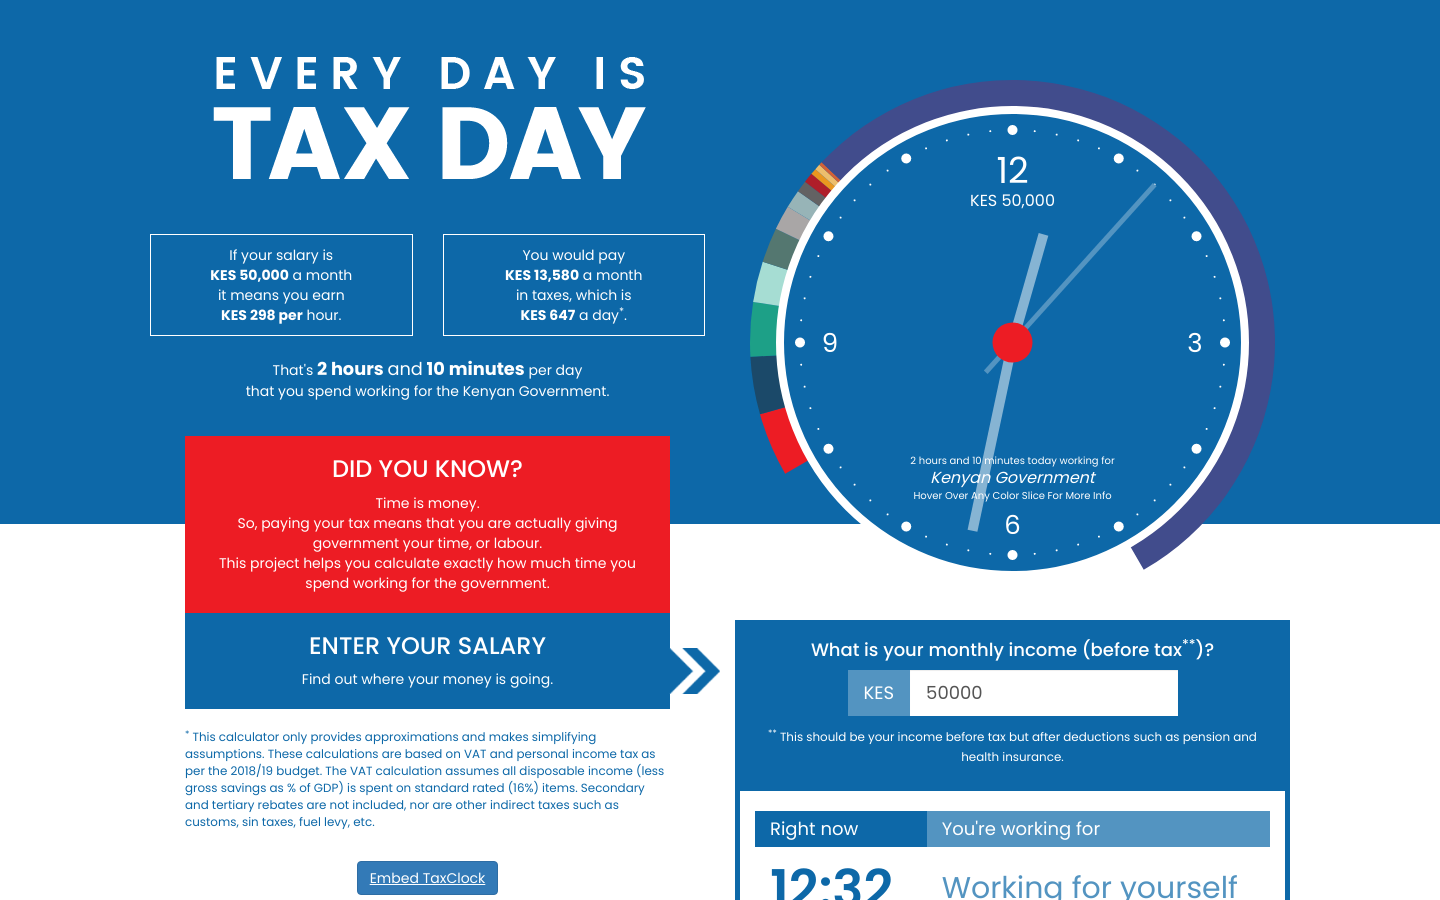
TaxClock shows how public budget data can be used to help citizens better understand how governments spend our taxmoney.
This story map was created with the Story Map Series application in ArcGIS Online.
The Visualization and Data Analytics Research Center at NYU consists of computer scientists who work closely with domain experts to apply the latest advances in computing to problems of critical societal importance, and simultaneously generate hypotheses and methods that new data sources and data types demand.