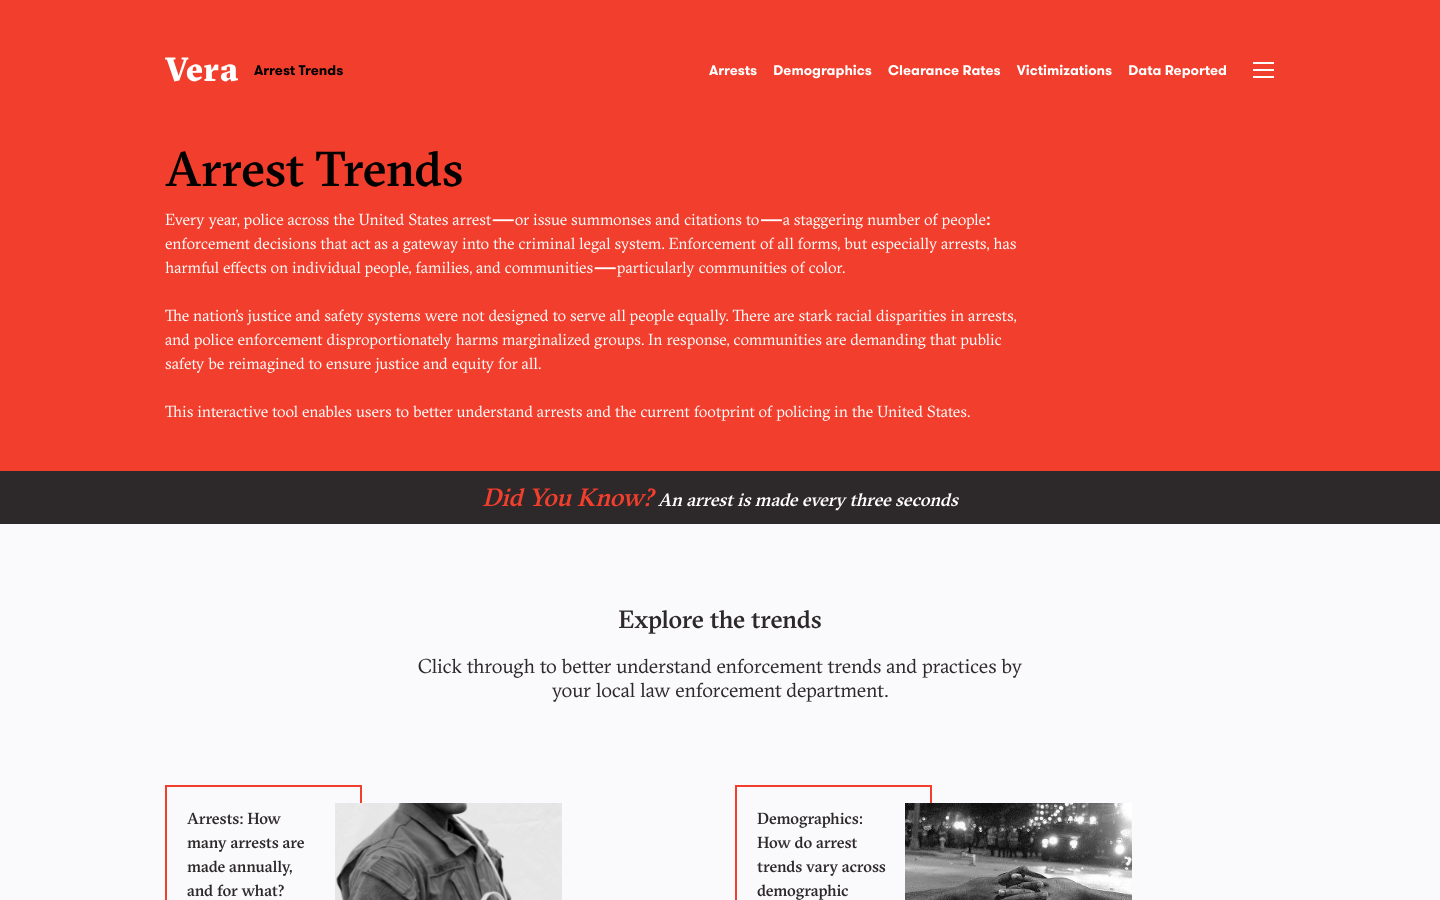
Vera Arrest Trends
This interactive tool enables users to better understand arrests and the current footprint of policing in the United States.
233 Broadway 12th Floor New York, NY 10279
criminal justice

Explore 215 projects in the Data Visualization category of the Civic Tech Field Guide.
This interactive tool enables users to better understand arrests and the current footprint of policing in the United States.
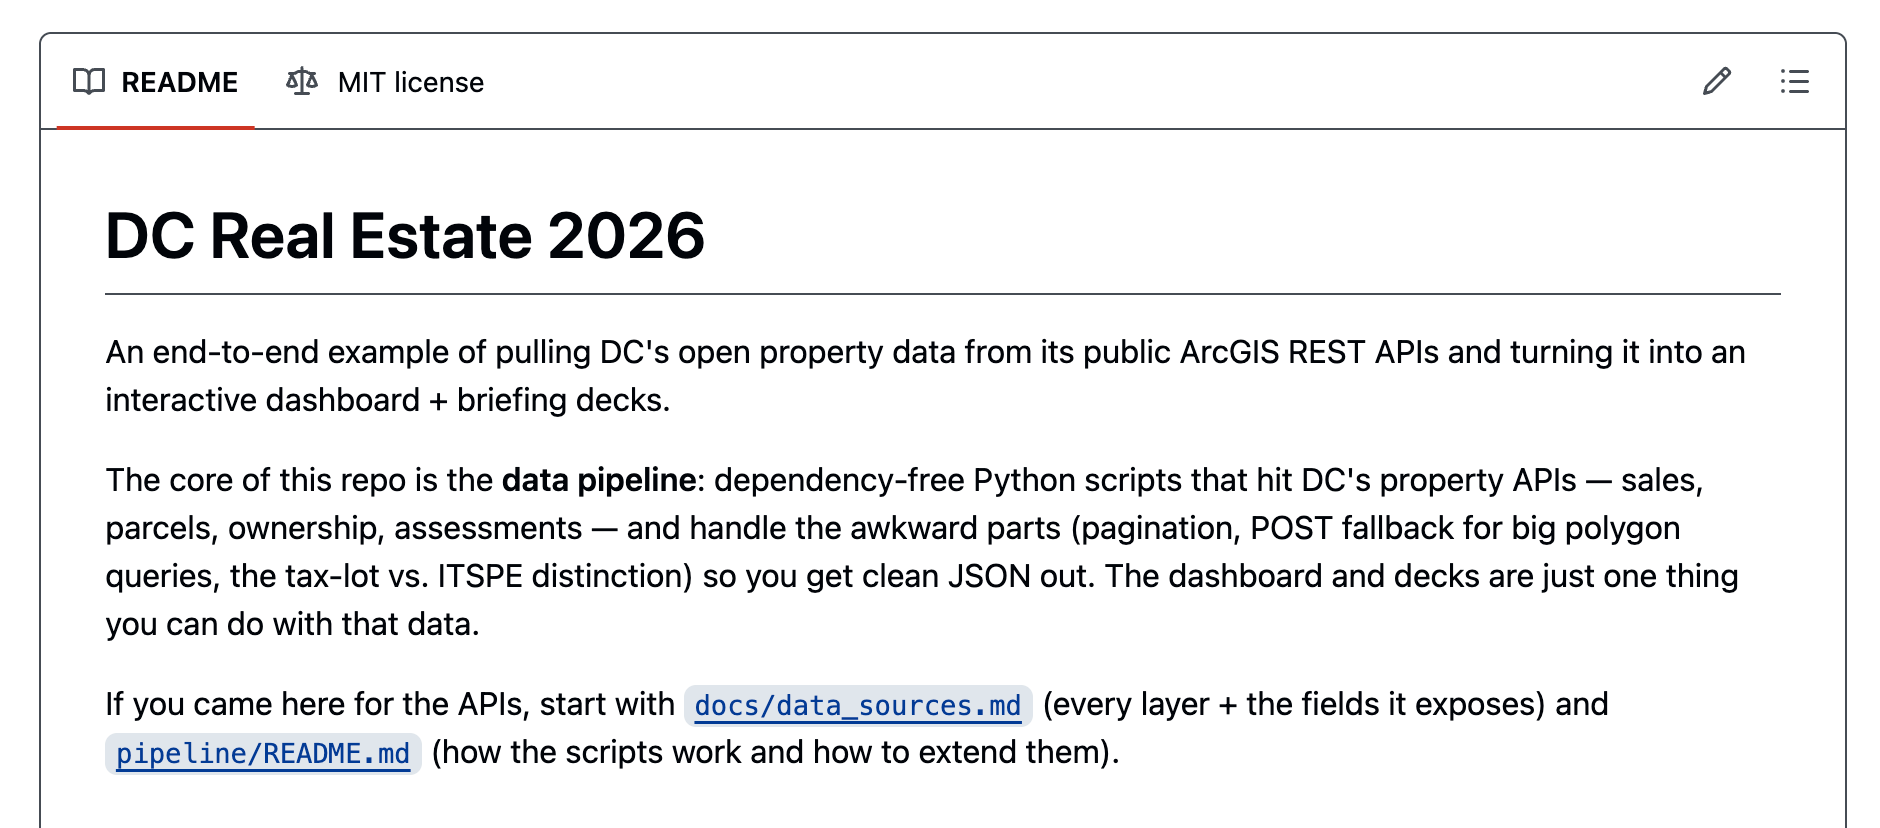
An end-to-end example of pulling DC's open property data from its public ArcGIS REST APIs and turning it into an interactive dashboard + briefing decks.
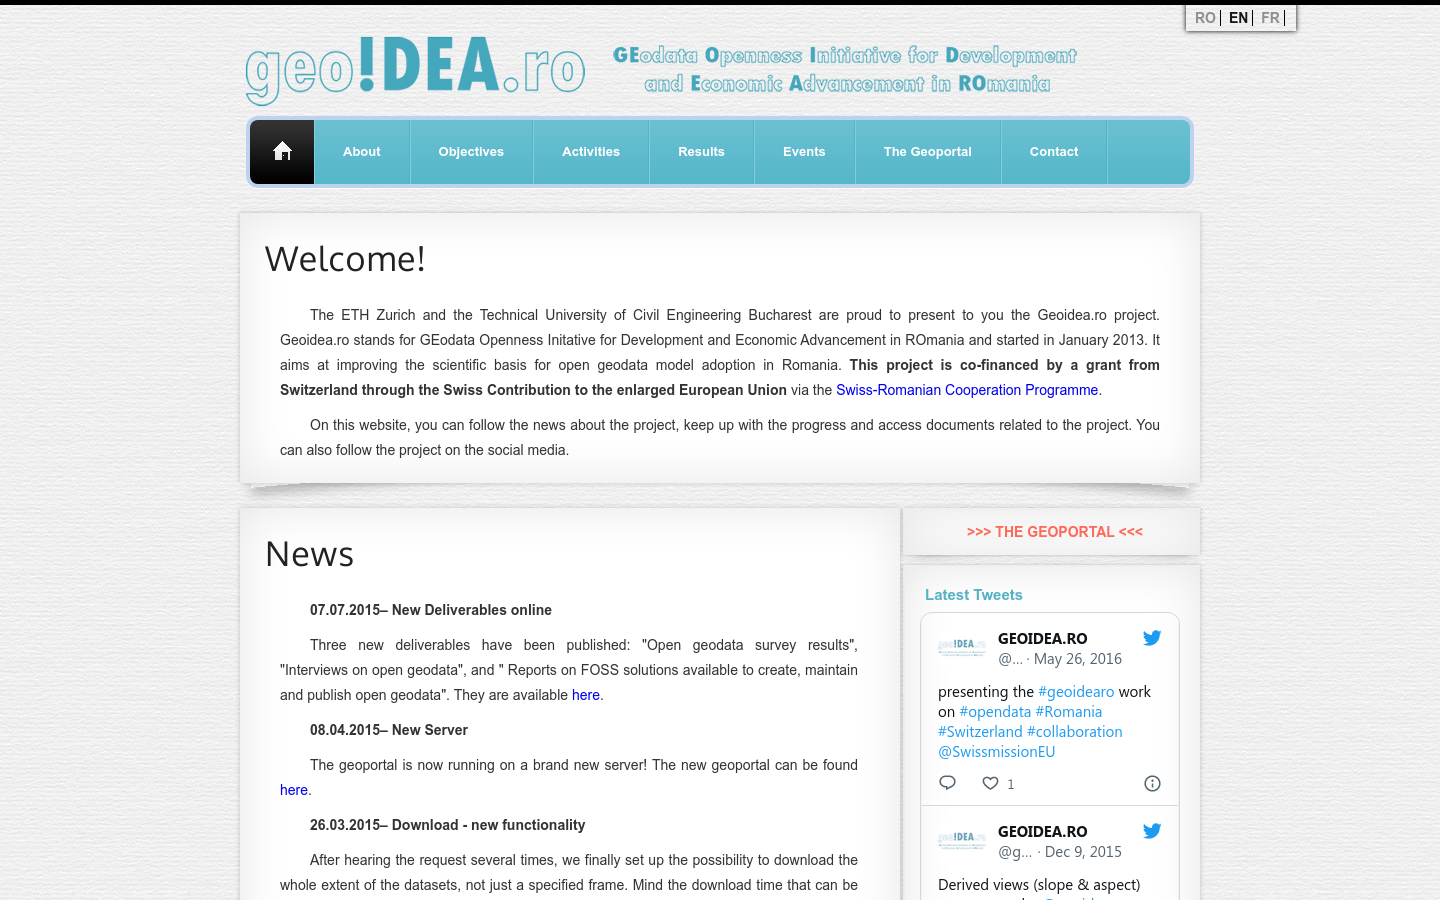
Geoidea.ro stands for GEodata Openness Initative for Development and Economic Advancement in ROmania and started in January 2013. It aims at improving the scientific basis for open geodata model adoption in Romania
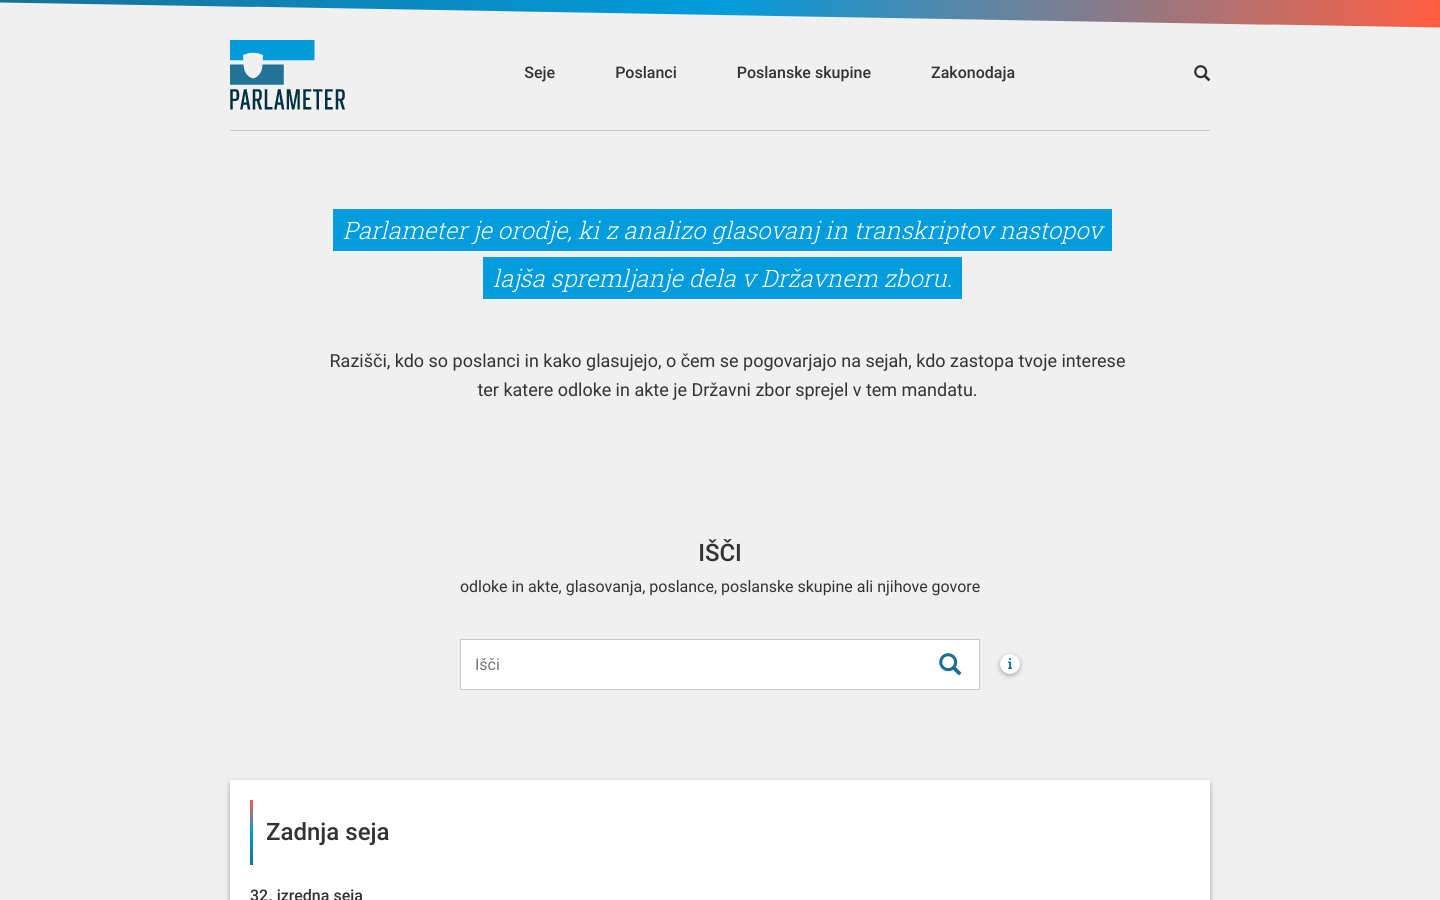
Transcripts and voting records digitalized! A complete solution for any organization aiming for full transparency and digitalization of sessions. Parlameter handles transcripts and voting records from their collection to visualization and publishing.
Enhancing everyday visualisation practice through generative and evaluative design tools for data scientists

The Democratic Erosion Event Dataset (DEED) records discrete events related to democratic erosion and autocratic consolidation across countries and over time.

J++ is an international team of data journalism specialists, with offices in Stockholm and Porto. The team integrates experts in research, data analysis, data-driven storytelling, newsroom programming and full-stack design.
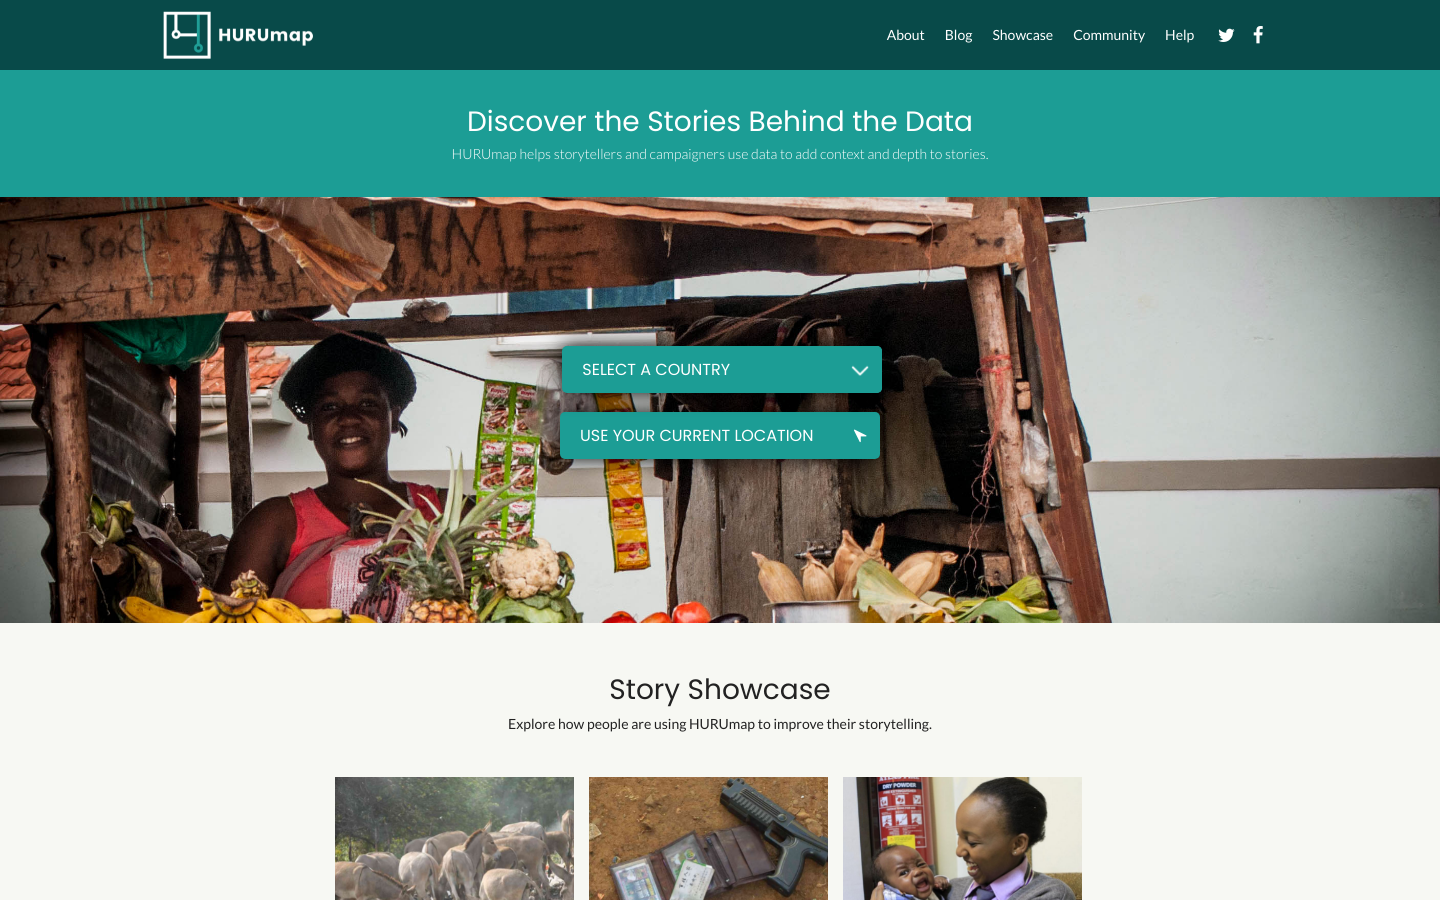
HURUmap gives infomediaries like journalists and civic activists an easy ‘plug & play’ toolkit for finding and embedding interactive data visualisations into their storytelling. The project's underlying data is quality-checked, from reputable official sources including the government Census, PEPFAR and Uwezo.

Every network tells a story