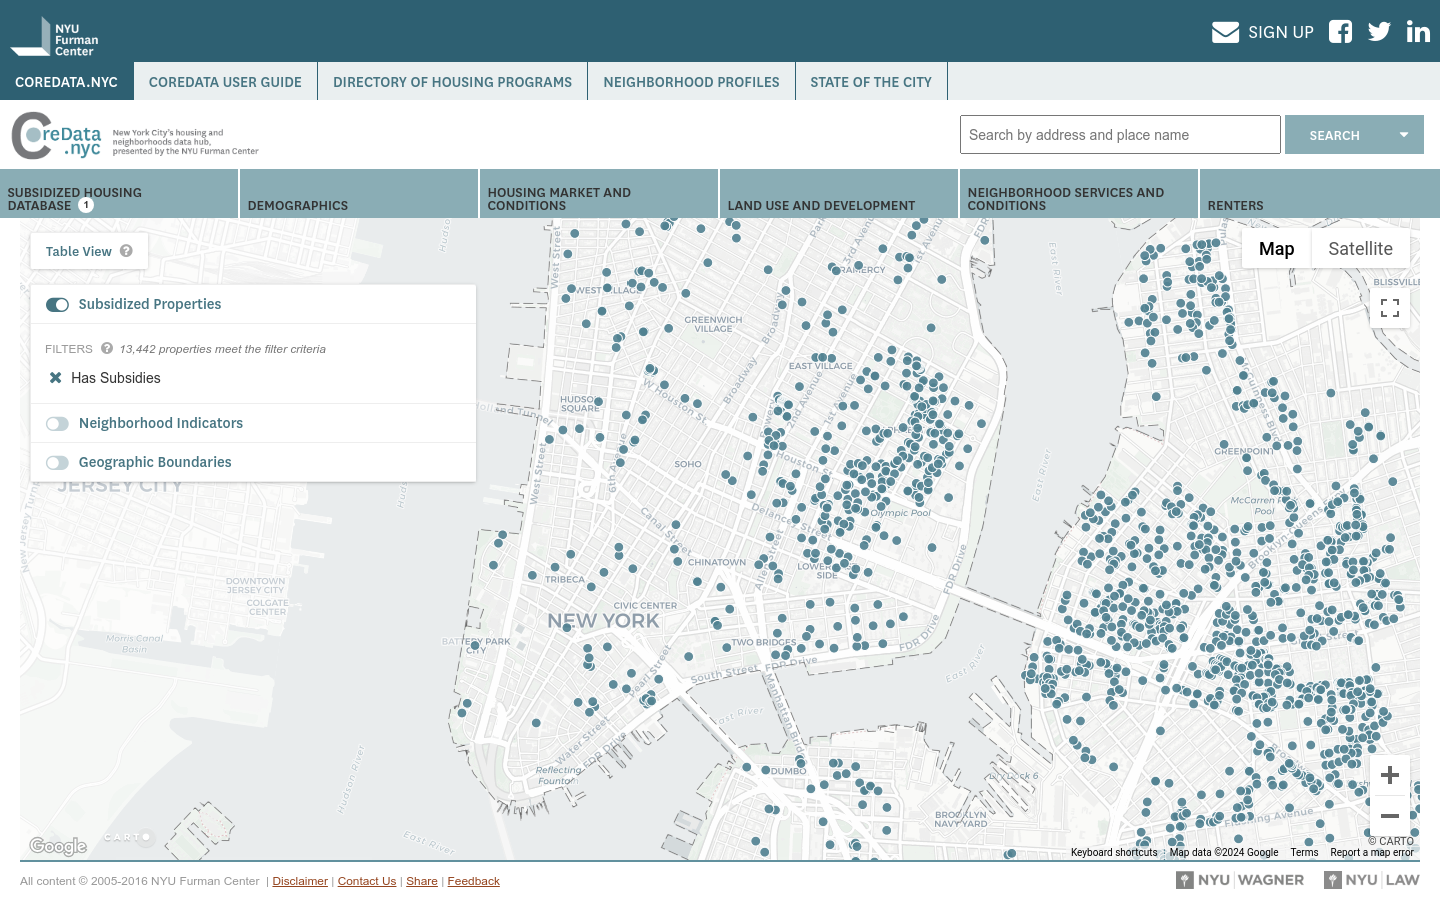
CoreData.nyc
CoreData.nyc is New York City’s housing and neighborhoods data hub, presented by the NYU Furman Center.
city, housing, Sustainable cities and communities

Explore 215 projects in the Data Visualization category of the Civic Tech Field Guide.
CoreData.nyc is New York City’s housing and neighborhoods data hub, presented by the NYU Furman Center.
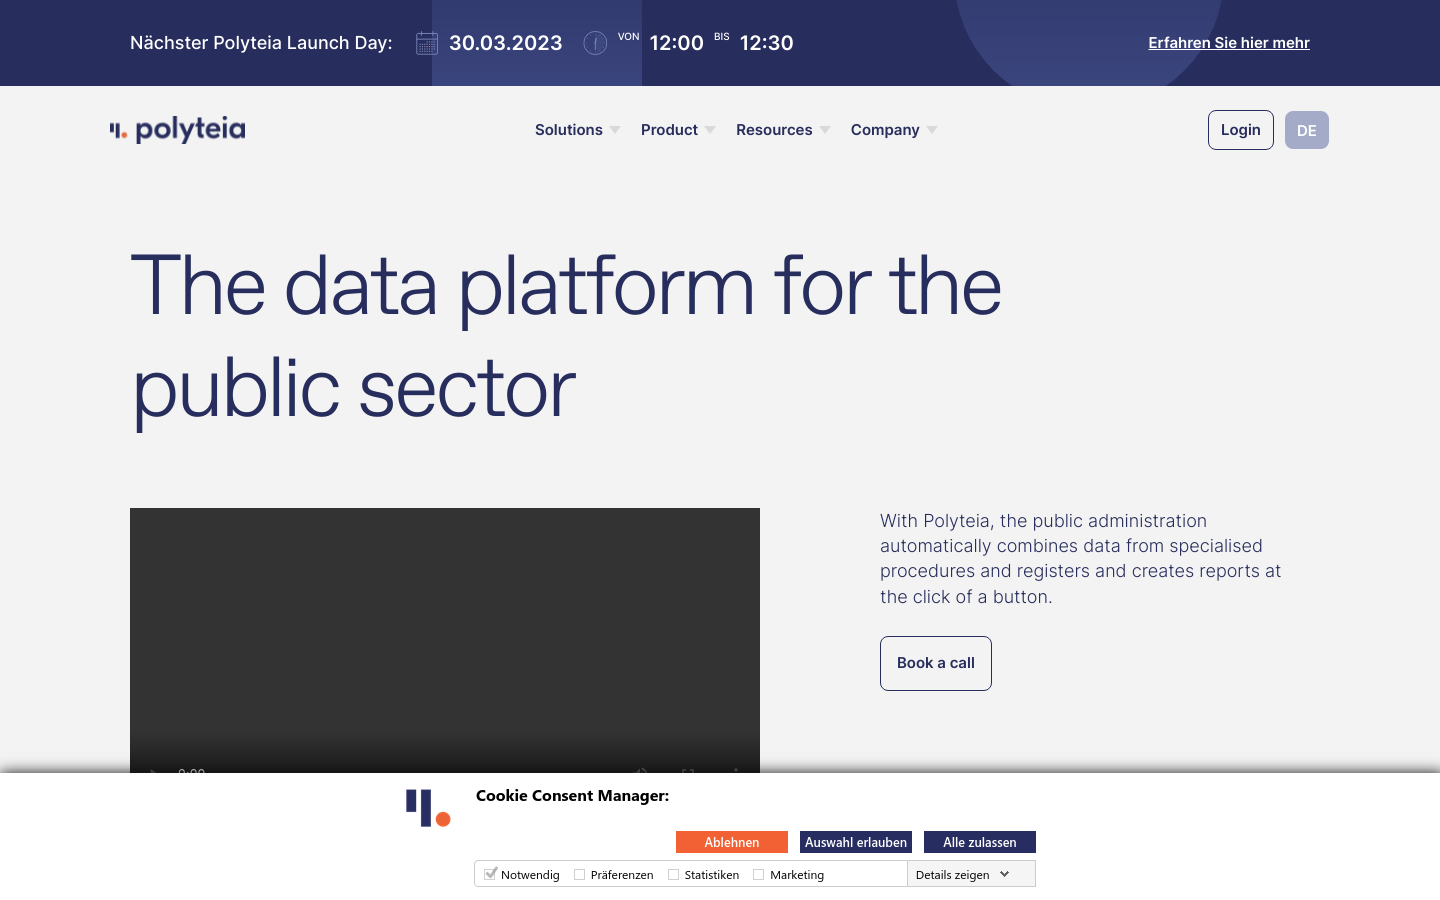
The smart governance platform for cities and towns. Wir ermöglichen Entscheidungsträgern in Städten und Gemeinden, datengetrieben zu steuern.
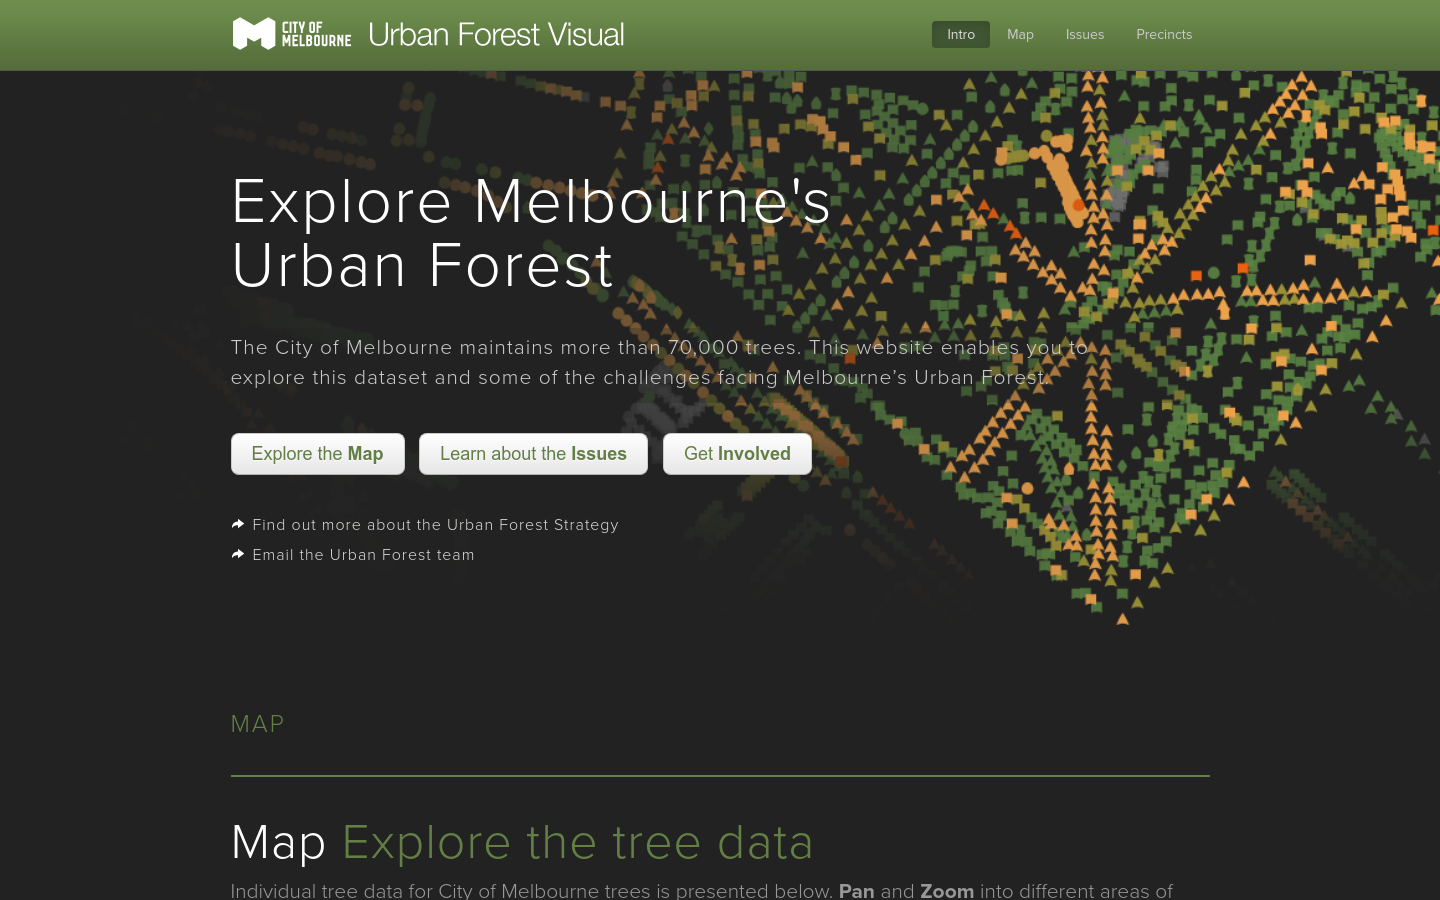
People from around the world are sending emails to trees in Melbourne, expressing their love, admiration, and curiosity about the trees
Supernormal explored an algorithm that integrates social equity as a key variable in prioritizing infrastructural replacements and repairs.
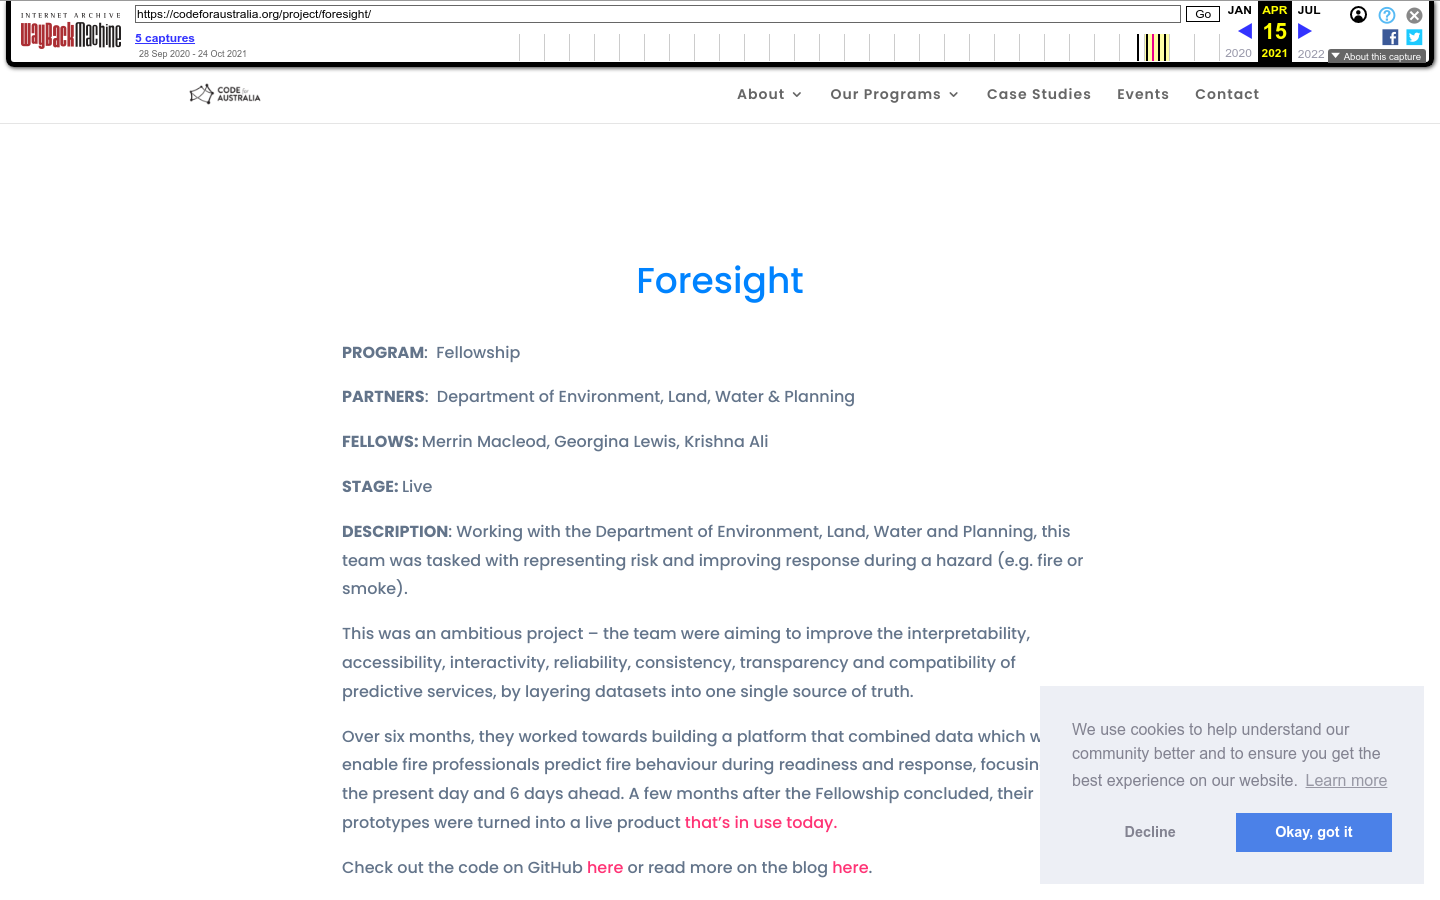
Foresight is a platform that layers complex datasets into one single source of truth.

Supply chain mapping software that enables companies to trace products to the source – tracking social, financial, and environmental risks every step of the way
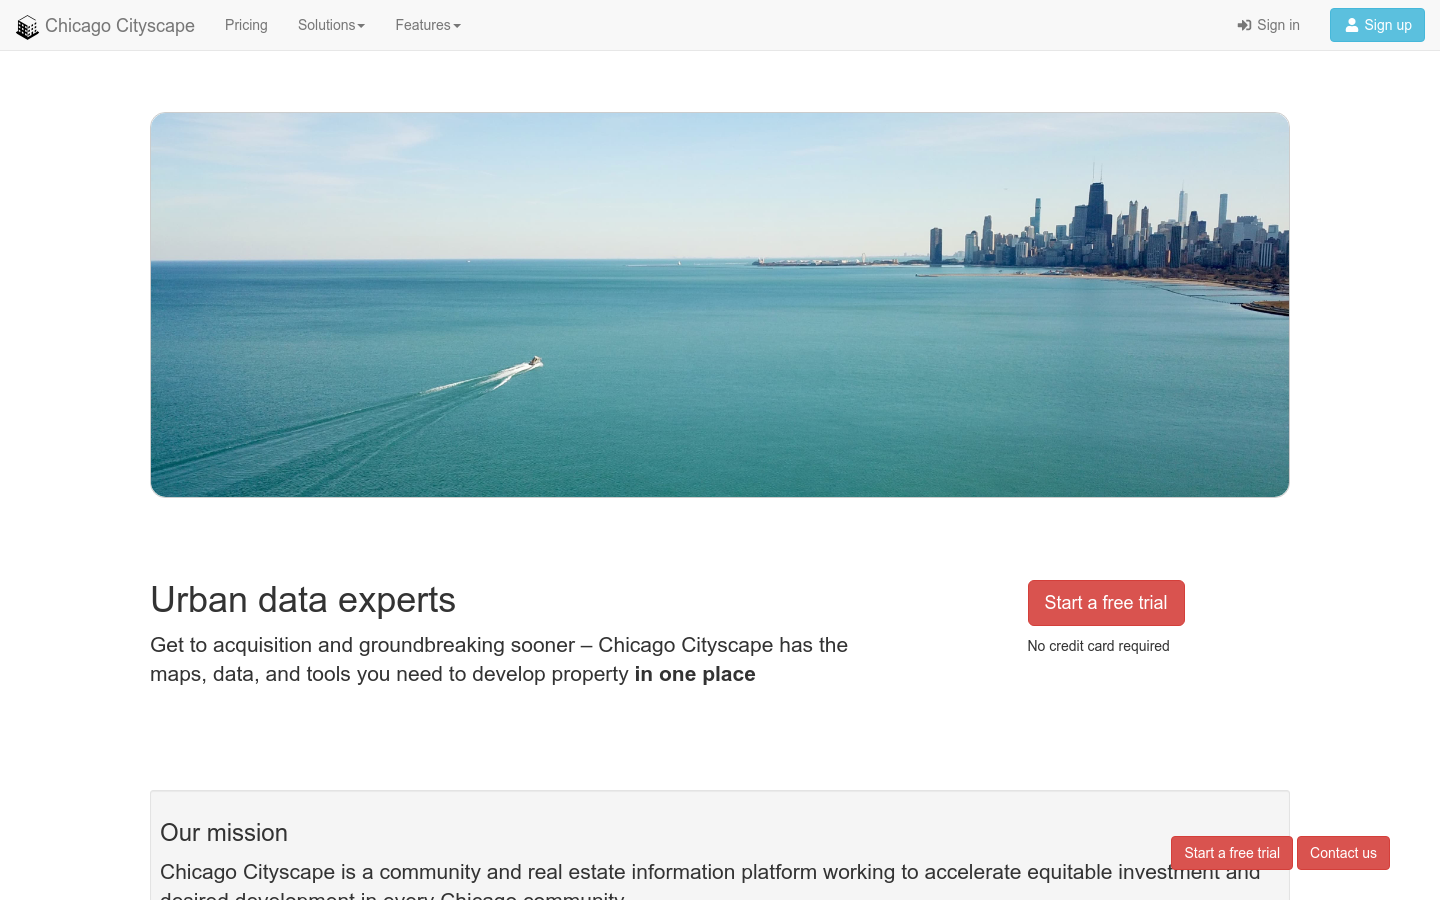
Chicago Cityscape shows where development is happening by combining data from dozens of sources.
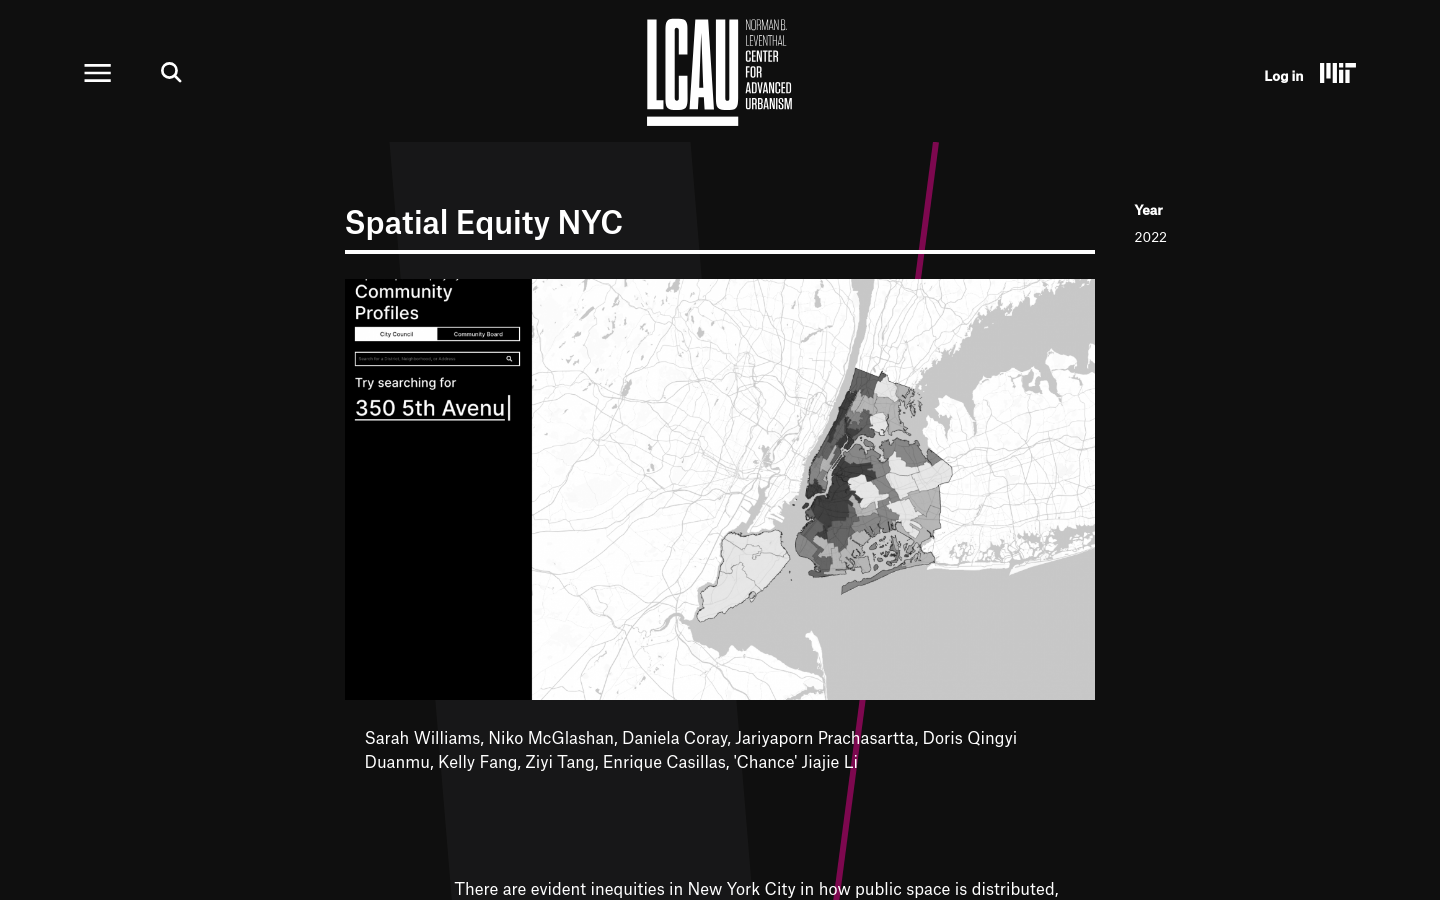
Spatial Equity NYC (SE), a tool developed by MIT’s Norman B. Leventhal Center for Advanced Urbanism (LCAU) in close collaboration with New York City-based nonprofit Transportation Alternatives (TA), visualizes mobility, environment, and health data.
A live dashboard analyzing the top German candidate's presence on multiple social media platforms.