Civic Tech Field Guide
Donate

https://airqualitystripes.info/

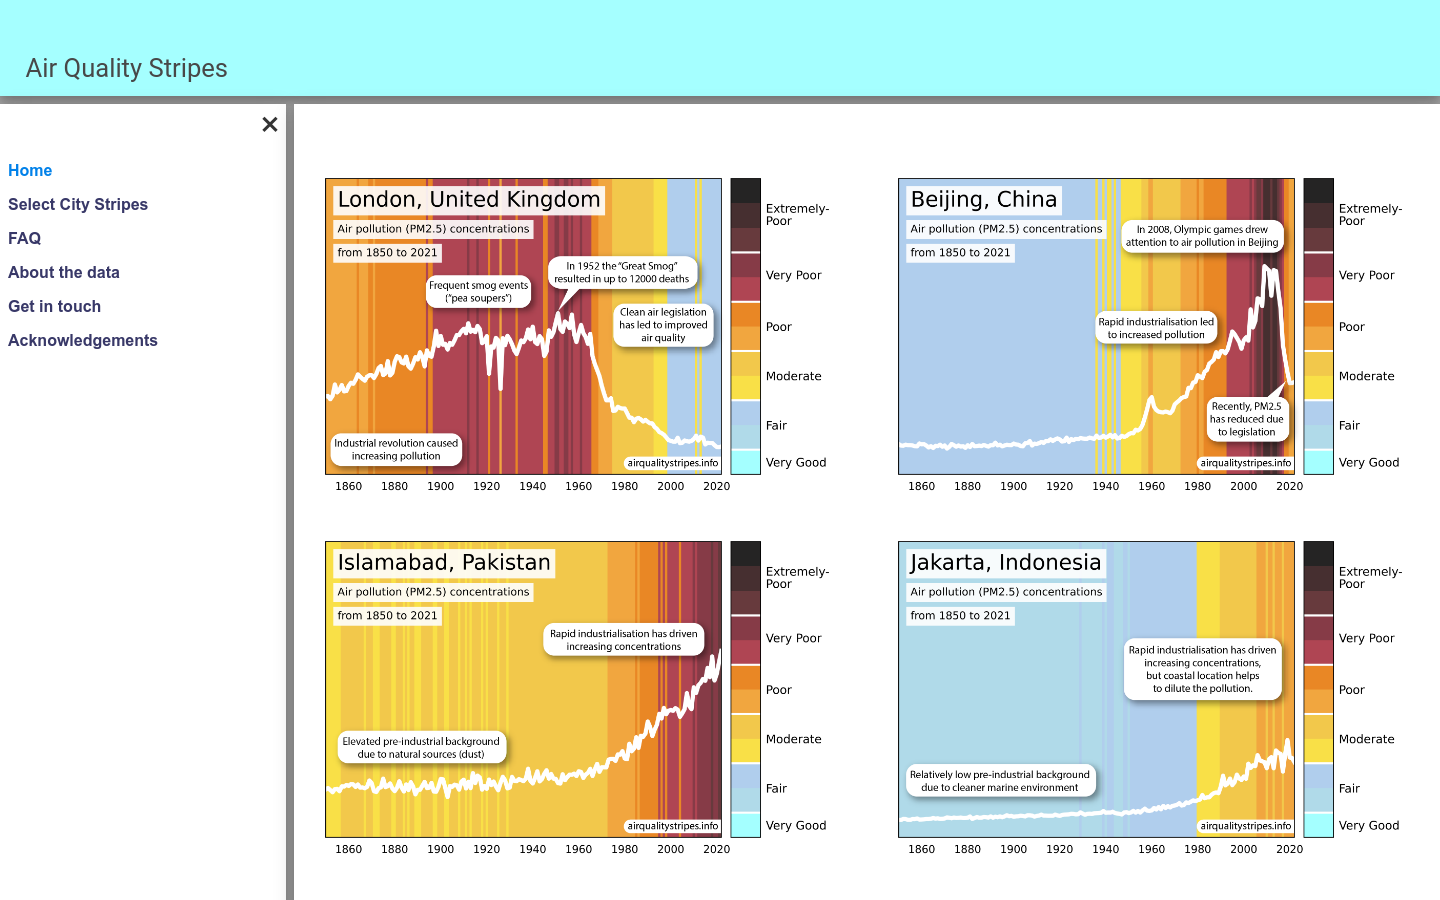
Air Quality Stripes

Data visualization plots showing the changing trends in outdoor concentrations of particulate matter (PM2.5) air pollution from 1850 to 2021 in cities around the world

Active

The cleanest air in this time period is coloured light blue and the dirtiest is coloured brown. There are many types of air pollution, but we only show particulate matter (PM2.5) concentrations as these have been closely linked to effects on human health.

Project type
Resource
Language(s)
English
Added
2024-09-16
Last modified
2026-07-12T16:44:59.000Z

Additional details

Number of integrations
0
Issues addressed
air quality
Geographic focus
Global

More in Civic data